USER EXPERIENCE, INTERFACE, AND INTERACTION DESIGN
Data Storytelling
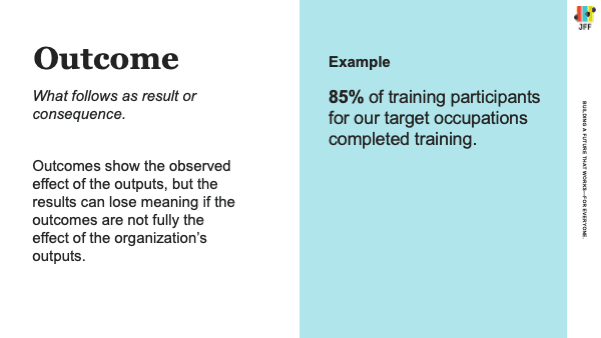
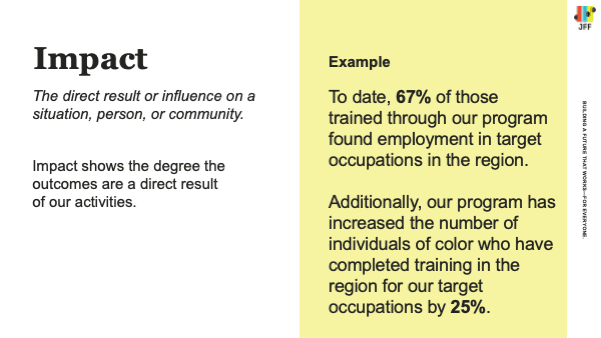
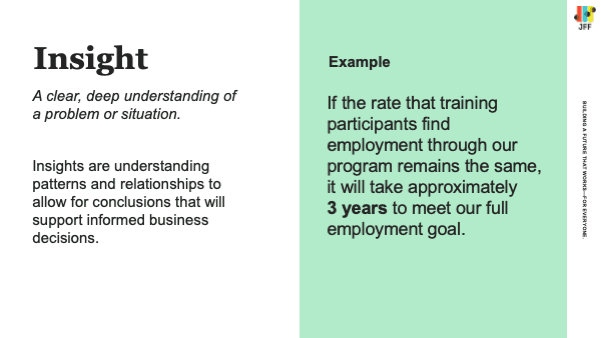
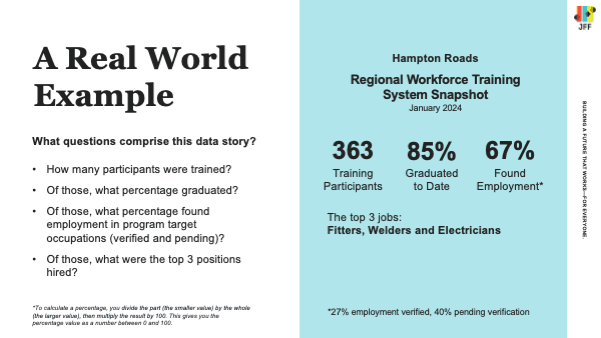
Transform complex data into meaningful narratives that inform, persuade, and engage an audience.

Program Goal
Demonstrate how aggregated workforce data could be translated into meaningful, trustworthy data stories that support learning and insight across regions—without misrepresenting individual communities.
My Role
Lead UX designer and data storyteller responsible for experience design, site design and build, collaboration with BI on data visualization, and stakeholder validation of a public pilot site.
Key Insights
Data stories must balance insight with responsibility—especially when representing multiple regions with uneven data depth.
While aggregated data revealed valuable cross-regional patterns, workforce boards were understandably concerned about how thin or partial data might be interpreted when viewed publicly. Designing transparency and context into the experience became as important as the data itself.
Impact
Delivered a pilot data storytelling site demonstrating the potential of cross-regional workforce insights
Validated the concept with cohort workforce boards and external partners
Identified key limitations of aggregated regional data, informing future methodology, governance, and scaling considerations
Established design patterns for transparency and contextual framing—such as disclaimers and narrative scaffolding—to reduce risk of misinterpretation in public data products
Strengthened trust with cohort partners by explicitly addressing representation concerns prior to release
Informed future thinking about methodology, governance, and scale for multi-regional data products
My Challenge
Turn a complex, constrained, and incomplete shared data set into a coherent, public-facing experience—while maintaining trust with workforce partners and avoiding misrepresentation.
Users
Primary users: Regional workforce boards participating in O4O cohorts
Secondary users: Policymakers, funders, and workforce system partners, and public viewers of the data storytelling site
Scope and Constraints
Two-year pilot with evolving team composition
Strict data governance and security requirements
Limited comparability across regional data sets
Sensitivity around public representation of local workforce efforts
My Process
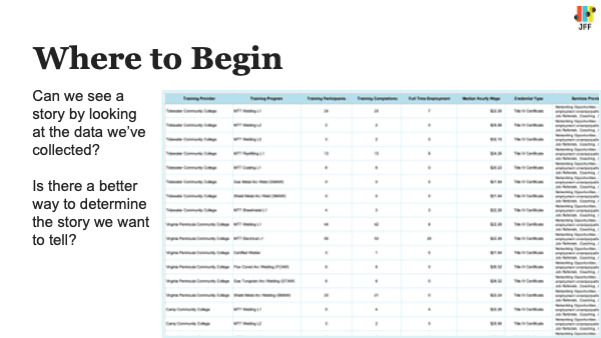
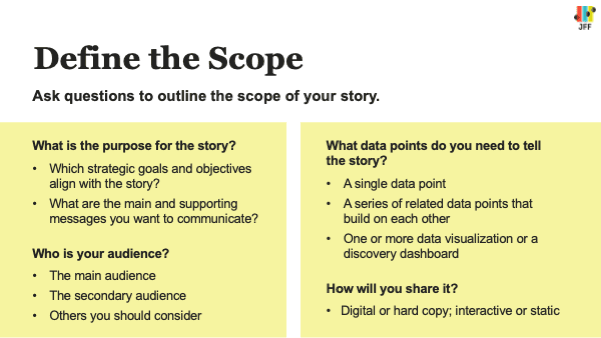
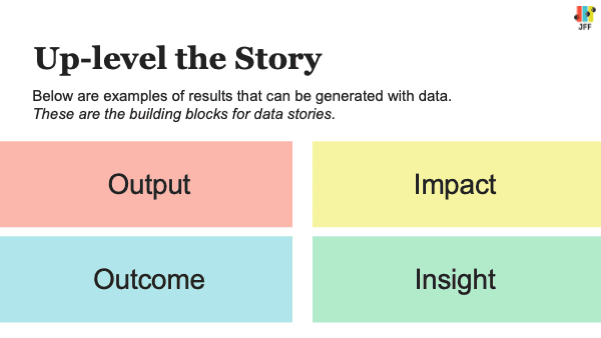
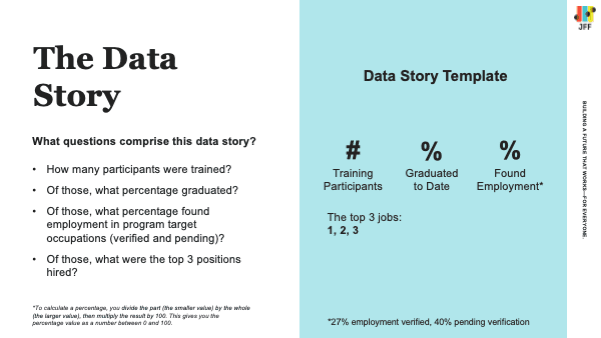
Collaborated with the project team to identify high-value data themes using the previously developed data storytelling framework
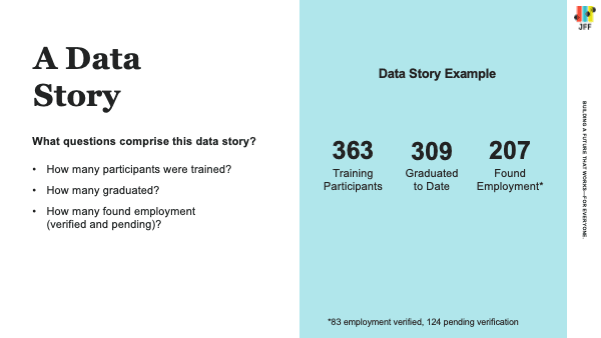
Defined a storytelling approach that paired narrative insight stories with exploratory dashboards
Created wireframes to communicate information flow and visualization requirements to BI partners
Designed and built a lightweight site to host data stories and contextual content
Partnered closely with a BI analyst to refine dashboards built in Domo, ensuring accessibility and coherence
Addressed technical challenges with embedded dashboards, including cross-domain resizing issues, by working directly with Domo support
Validated the site with cohort workforce boards and negotiated transparency measures, including disclaimers, to contextualize aggregated data prior to public release
Organizations
JFFLabs, Brighthive, Google.org (funder)
My Role
Lead UX Designer
Date / Duration
Sep 2020 - Jul 2022


Program Goal
Strengthen data literacy and evaluation practices among Good Jobs Challenge grantees by providing practical, peer-grounded approaches to data storytelling that support learning, communication, and decision-making.
My Role
UX and data strategy lead responsible for designing and facilitating an interactive data storytelling workshop at the 2024 Good Jobs Challenge convening in Washington, D.C. and mentoring a junior team member as co-presenter.
Key Insights
Data literacy improves fastest when people actively work with their own context—not abstract examples.
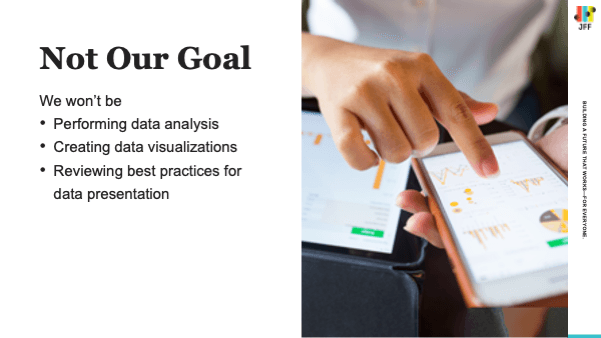
Rather than presenting static best practices, the workshop was designed as a hands-on learning experience using real program data, enabling participants to practice building meaningful data stories they could apply immediately in their own work.
Impact
Delivered a highly engaged, hands-on workshop for Good Jobs Challenge grantees
Elevated participants’ confidence in interpreting and communicating data
Earned strong positive feedback from grantees and representatives of the U.S. Economic Development Administration
Invited to deliver a follow-up virtual session to reach a broader national audience
Provided leadership and presentation mentorship to a junior team member, supporting skill growth and visibility
My Challenge
Design and deliver a 45-minute breakout session—approved in advance by a federal agency—that meaningfully improved data storytelling capability across a diverse group of workforce grantees within a tightly constrained agenda.
Users
Participants: Good Jobs Challenge grantees attending the 2024 convening.
Scope and Constraints
Fixed 45-minute session length
Content and format subject to advance approval
Broad range of data maturity and experience among participants
Emphasis on peer learning and practical application
My Process
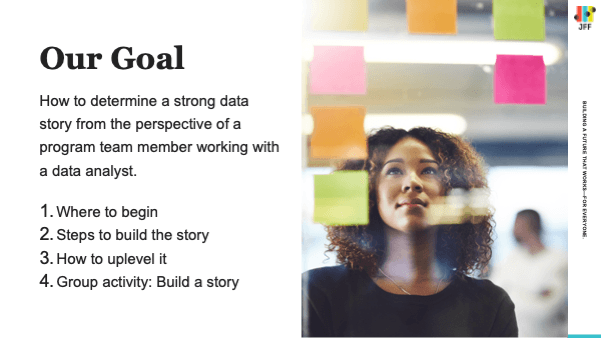
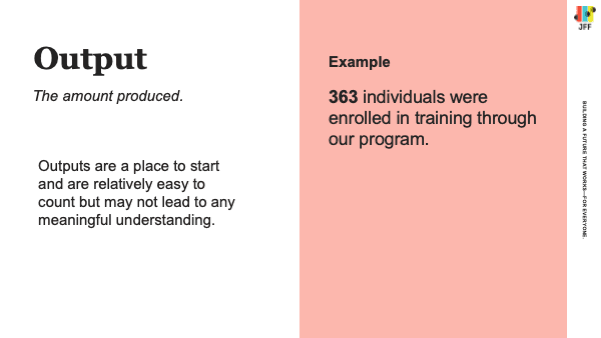
Proposed a data storytelling workshop focused on foundational building blocks and applied practice
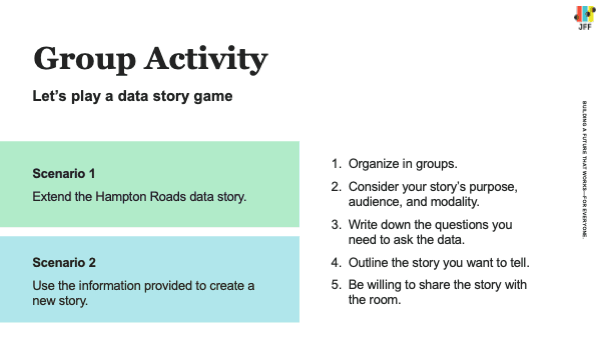
Designed an interactive session format balancing instruction, discussion, and hands-on activity
Recruited and mentored a junior colleague as co-presenter to support skill development and shared facilitation
Partnered with a program grantee to use real, publicly available data and reinforce peer learning
Developed session materials and activities to fit within time and approval constraints
Facilitated the session and adapted in real time based on participant engagement
Organizations
JFF, EDA
My Role
UX and data strategy lead
Date / Duration
May 2024